Memory aspects in scientific coding
Introduction
When we write scientific code, we often deal with large amounts of data and numerous data processing steps. Not rarely will we face out-of-memory errors, when the data gets too large for our RAM. Here are 5 tips on what to keep in mind when running into such problems.
Tip 1: Understanding and Profiling
Before actually working on memory issues, we need to understand them fully. Technically, there are tools called profilers that help us with this which I will get into as well. But you can do some very simple things first do understand whether and how your memory is exploding.
print statements
As a first simple step, add some print statements. This has two benefits: for one, you can see until which point your code actually runs. This already helps tremendously in figuring out what part of the code is making problems. The second benefit is that we can print out the variable sizes, giving us more details on what is currently happening in our memory. Note: Your coding environment (RStudio, DataSpell, …) will also give you options to execute code on a line-by-line basis, and can show you what’s currently stored in memory! Also make use of that. For me, however, I often need to get back to these raw tools, because a coding environment itself requires a lot of memory. So when I am dealing with memory issues, I usually exit the coding environment and run the code from the command line.
corine_data = rxr.open_rasterio('other_inputs/corine_data_full_mapped_classes.tif', chunks={'x': 1000, 'y': 1000})
pucher_data = rxr.open_rasterio('/home/konni/Documents/phd/data/forest_age_pucher/agecl_1_perc.tif')
print(f"Memory usage of corine_data (approx): {corine_data.nbytes / (1024 ** 2):.2f} MB")

target_classes = [311, 312, 313]

print('create mask')
corine_mask = xr.where(corine_data.isin(target_classes), 1, 0).astype(np.int16)
print(f"Memory usage of corine_mask (approx): {corine_mask.nbytes / (1024 ** 2):.2f} MB")

print('reproject to get CORINE sums in Pucher resolution')
class_count = corine_mask.rio.reproject_match(match_data_array=pucher_data, resampling=Resampling.sum)
print(f"Memory usage of class_count (approx): {class_count.nbytes / (1024 ** 2):.2f} MB")

print('convert to float')
class_count = class_count.astype(float)
print(f"Memory usage of class_count after conversion to float (approx): {class_count.nbytes / (1024 ** 2):.2f} MB")
print('divide')htop and similar tools to understand memory consumption

htop is a command line tool that shows you the usage of your computer resources. It can show you your memory consumption per program, and also whether the memory is swapping (see the Swp line in the image above: 6GB of my swap was in use). This is the computer’s last resort and means that the memory is copied to disk. This keeps the computations alive but makes them extremely slow (often they then will never finish).
So, htop (or alternatives) will help you understand what is happening, for instance, how fast the memory is blowing up. Together with the print statements, you can understand where your memory consumption is still in the boundary and when it gets too big. Furthermore, it shows you which other programs are currently taking up memory. As I mentioned previously, for computation-heavy code, I often close all other programs like web-browser, developer environment, and so on.
Actual profilers
There are actually professional tools to do the profiling (= resource analysis) for you, and there are numerous options for each profiling language. Here, I want to show you mprof which works with Python. Installation and usage is super easy:
pip install memory-profiler
mprof run myscript.py
mprof plot
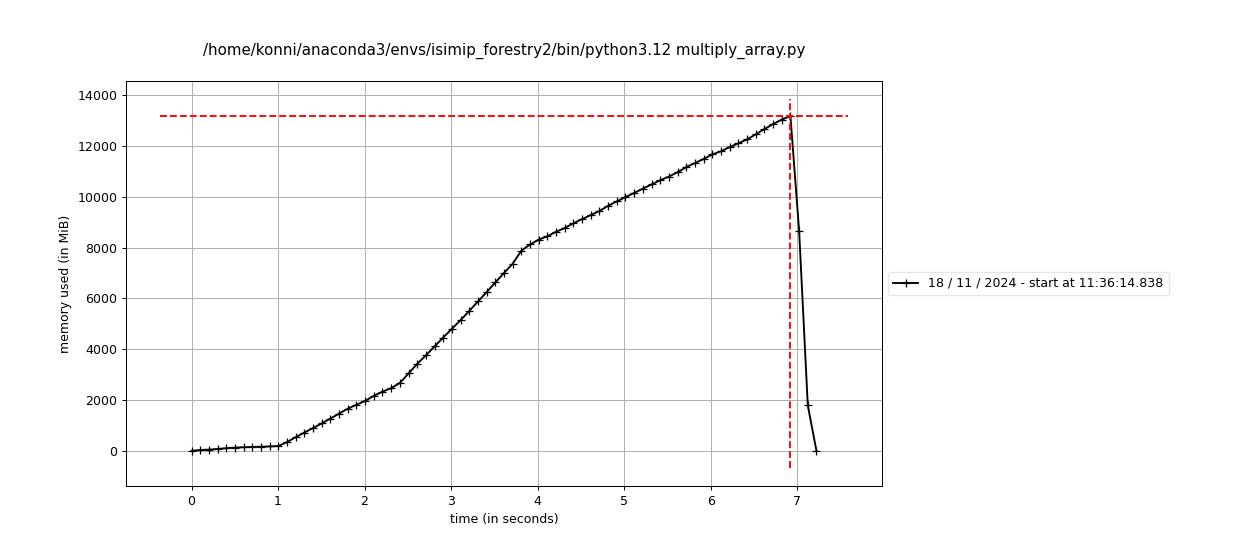
That’s it! This will sample memory usage every 0.1 seconds and give you a plot on the memory performance like the one below. Together with some print statements will help you tremendously in understanding where the memory blows up.

Tip 2: Reduce the amount of variables stored in memory
A first simple way to reduce memory consumption is reducing the amount of stuff we’re keeping in memory. Scientific code often looks like this:
dataset = read_data(filename)
dataset_converted = convert(dataset)
dataset_interpolated = interpolate(dataset_converted)
...
After the first three lines, do we really need to get back to the original dataset at any point? Probably not. But your software does not know that, so these variables stay in memory. In this case, you can simply override the original variables like so:
dataset = read_data(filename)
dataset = convert(dataset)
dataset = interpolate(dataset)
...
This allows the programming language’s garbage collection processes to free up memory. Basically, they look for stuff in memory that surely cannot be used anymore in the code and free up this memory. In the updated example, the intermediate results do not need to be kept in memory and can be garbace collected.
Tip 3: chunking
Often, your operations do not require knowledge about all data at all times. Check out the following code:
import rioxarray as rxr

data = rxr.open_rasterio('myfile.tif')
data = data * 2
The operation at one entry of the dataset needs no information from the rest of the dataset, right? So what we can do here is apply the operation on chunks instead of on the whole dataset at once. For that we can simply load the file in chunks like so:
import rioxarray as rxr

data = rxr.open_rasterio('myfile.tif', chunks={'x': 1000, 'y': 1000})
data = data * 2
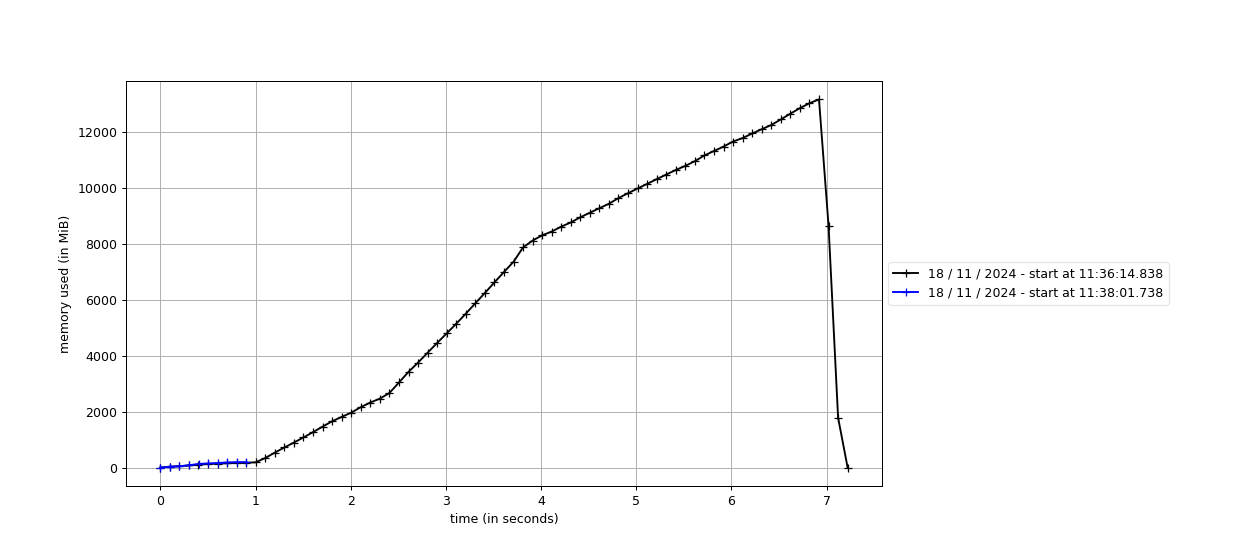
I profiled these two code snippets using a roughly 5GB large random tif file, and the differences are tremendous! Without chunking, the script took 7 seconds and needed 13 GB of RAM. Adding chunking reduced the runtime to 1 second, and the memory usage to 200MB! The following image is the output of the mprof profiler. You can barely see the chunked run, it’s the blue line in the bottom left!

Other libraries have their own chunking options. So the tip here is to simply check whether there are options for chunking in the library that you’re using!
Tip 4: Data types
An absolutely critical and extremely powerful aspect of memory efficiency is the way that the data is actually stored in memory. To understand this better, we need to dive a bit deeper into how that actually happens in the first place.
Introduction to data types
Depending on the programming language you use, you might be more or less familiar with data types. In Java or C++, for instance, you always need to make explicit which data type a certain variable has:
double floatingPointNumber = 1.333;
int integerNumber = 5;
boolean trueOrFalse = true;
String text = "hello"
In those languages, you cannot assign anything to a variable that doesn’t adhere to the type:
text = 5.9;This will immediately cause an error because text is String but 5.9 is a double (floating point number with “double” precision). For some other situations, however, this works because the language immediately knows what’s supposed to happen:
floatingPointNumber = integerNumber; // automatically converts 5 to 5.0
integerNumber = floatingPointNumber; // does not work and creates a compiler error
But in many other languages, especially R and Python, this might not be obvious. In Python, for instance, you can happily assign anything to any variable:
floatingPointNumber = 40.0
floatingPointNumber = 'hello'
floatingPointNumber = True
Those languages will always doing their best in trying to understand what you’re trying to do, and you never really have to think about data types. But internally, every variable still has a data type and this is what we can look into when we have memory issues.
Leveraging data types
So, even though you might not see it, all data is stored with some data type. And here is where a huge option for optimization lies. Let’s see first what these data types are.
A classical number representation in programming is a 32bit integer. A variable of that type can hold every integer number between \(-2^{32}\) and \(2^{32}-1\). To allow for this large range, this variable needs 32 bits of storage, or 8 bytes. Let’s say your data array is 1000x1000 in size. This means, the raw data of that array without any other overhead is 1000x1000x8 = 8.000.000 bytes or ~7.6 Megabytes. That’s not a problem, but in many scientific problems, we need to deal with arrays of sizes like 100.000 x 10.000, so that will be already ~7.6 Gigabytes!
But do you really need the full range of values? Maybe you know your values are maximally up to 100 or so. In that case, you could store your array with int8 (range: -128 to 127). This only needs 8 bits, or 1 byte. Then, the 100.000 x 10.000 array will only require 100.000 x 10.000 x 1 / 1024^2 = ~950 Megabytes! We just saved 6.5 Gigabytes of memory!
import numpy as np

array = np.random.randint(0, 101, size=(100000, 10000))

memory_usage_in_bytes = array.nbytes / (1024 ** 2)

array_int8 = array.astype(np.int8)
converted_memory_usage_in_bytes = array_int8.nbytes / (1024 ** 2)

print(f'{memory_usage_in_bytes:.2f}, {converted_memory_usage_in_bytes:.2f}')
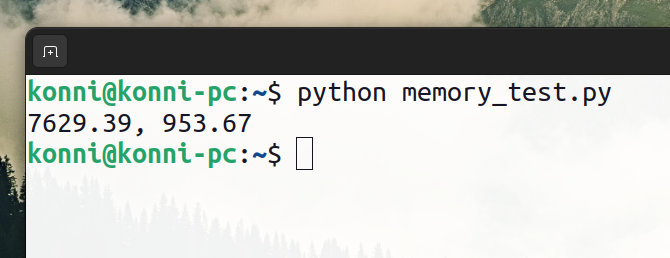
The output of this will be the Megabytes that are needed to store these arrays: 7629.39 953.67, so we just saved over 6GB of RAM:

Tip 5: Lazy loading
Many data science libraries offer the option of lazy loading. This means that the data is only read when it is actually needed, and not read in full into memory where it can really blow up.
The following line, reading a ~3GB data file, recently completely blew up on my machine with 32GB RAM:
import xarray as xr
tas = xr.load_dataset('isimip_data/chelsa-w5e5_obsclim_tas_300arcsec_eu_daily_allyears_1979_2014_ncks.nc')
In the end all I had to do was enable lazy loading, by simply replacing load_dataset with open_dataset and let the library do its magic:
tas = xr.open_dataset('isimip_data/chelsa-w5e5_obsclim_tas_300arcsec_eu_daily_allyears_1979_2014_ncks.nc')My entire code then ran without needing more than 6GB of memory.
Depending on your code and the libraries you use, there might be numerous ways in applying lazy loading. When you used some profiling to understand where things are blowing up, you can probably figure out whether this could help. In that case, you can simply ask ChatGPT explicitly how to make use of lazy loading within your code. However, it really depends on your code whether lazy loading will help you.
Conclusion
Memory consumption is a complex issue. And today we often luckily have large enough machines to deal with the large data we work on. But still, we sometimes exceed this capacity. Hopefully the tips I mentioned can help you deal with this. To recap, here are things you need to do when you apparently have a memory issue in your program:
- Check where the issue is and how big it is by checking your computer’s memory usage and profiling the code
- Are there variables you can optimize away to minimize the stuff that is held in memory?
- Can you leverage what you know about the data? If you’re sure about the maximum value of a dataset, maybe specifying a small data type explicitly reduces the memory cost.
- Make use of chunking and lazy loading options.
Hopefully this was helpful to you. If you would like to learn more about coding practices in science, please consider booking a course with me, click here for more info
Enjoy Reading This Article?
Here are some more articles you might like to read next: