A comprehensive explanation of radiative forcing and friends
Radiative forcing is a key concept in climate science. However, it is a complex topic and sometimes details are omitted or terms used interchangeably, which makes it hard to grasp. Therefore, I here try to summarize and synthesize the most important definitions, concepts, and their relations.
Let’s start with two keywords:
- Forcing: a perturbation to a system from a given state due to an external driver. The forcings we mean here may be greenhouse gas emissions, or land cover change.
- TOA: The top of the atmosphere - 100km above Earth’s surface.

Definition of radiative forcing
Radiative forcing refers to the immediate change in the top-of-atmosphere (TOA) energy balance (incoming vs outgoing energy) due to an external driver, before the surface can adapt.
Zero radiative forcing than means that the Earth is in energy equilibrium with the Sun. The amount of energy coming in from the sun is the same as goes out from longwave radiation and Earth has an equilibrium average temperature. This was roughly the case before the industrial revolution. Of course, solar energy input varies over the course of a year due to the way Earth and Sun are standing relative to one another, but on average, the energy budget remains the same.
Formally, the IPCC defines radiative forcing as “the change in the net, downward minus upward, radiative flux (expressed in W/m\(^2\)) due to a change in an external driver of climate change.” Those external drivers could be changes in solar radiation, volcanic activity, emissions of greenhouse gases, or land cover change. The IPCC marks the year 1750 as the baseline, assuming for this time a planet roughly in balance, and around zero radiative forcing.
Types of radiative forcing
Generally, scientists and the IPCC use the single term radiative forcing. But there are actually three types of it. Here are some details on the different types, but you can skip this information on first read. You can continue at “How is radiative forcing related to the energy balance of the Earth?”.
Instantaneous radiative forcing (IRF)
IRF is defined as the change in the net TOA radiative flux following a perturbation, excluding any adjustments (IPCC-AR6-WGI, p. 941). So, for instance, blowing greenhouse gases into the atmosphere will change how much radiation leaves the planet, and thereby creates an IRF. But the system does not stay that way! This immediate change in energy balance (and atmospheric composition) will lead to numerous other changes that occur. Therefore, there are two other radiative forcings defined: IRF is not really used by the IPCC except for some particular ones related to aerosols.
Stratospherically adjusted radiative forcing (SARF)
SARF is defined as IRF plus the response to stratospheric temperature adjustments (IPCC-AR6-WGI, p. 941). What this means is, blowing carbon dioxide into the air will actually lead to a cooling in the stratosphere (which starts between 8 and 18km above ground, Goessling and Bathiany, 2016)! This stratospheric cooling, by the way, is a key aspect of how the human impact of climate change is attributed, just saying (see this video).
SARF is computed with models, by fixing tropospheric properties, but allowing for stratospheric temperatures to readjust after a forcing (IPCC-AR6-WGI-Annex-VII).
Effective radiative forcing (ERF)
ERF is the most important radiative forcing. It quantifies the change in the net TOA energy flux of the Earth system due to a forcing, after accounting for adjustments in both tropospheric and stratospheric temperatures, water vapour, clouds, and some surface properties, such as surface albedo from vegetation changes, that are unrelated to surface temperatures (IPCC-AR6-WGI, Box 7.1). These adjustments used to be called “rapid adjustments” but that’s not the case anymore, it’s “the independence from surface temperature rather than the rapidity” that matters (IPCC-AR6-WGI 7.3). But the processes that are contained are usually fast processes that occur within hours to months, unlike the processes driven by the changing surface temperature which take much longer (IPCC-AR6-WGI Box 7.1). Namely, the processes are:
- tropospheric temperature: similarly to the stratosphere, there are also rapid changes in temperature in the troposphere, before the Earth’s surface temperature will change at all
- water vapor: the changes in tropospheric temperatures will affect the amount of water vapor that can stay there
- clouds: changes in tropospheric temperatures (and aerosols) also affect clouds
- albedo/land cover: for instance, when the driver of a forcing is land use change, there are also direct changes to the albedo, affecting the energy balance as well, but see also my example below.
Processes that are not included in ERF are those that are driven by surface temperature changes, for instance, ice albedo feedback, water vapor feedback, lapse rate feedback, or cloud feedbacks (Smith et al., 2020)
The IPCC calls the ERF the central definition of radiative forcing (IPCC-AR6-WGI, Box 7.1)
How much different are they?
Table 7.4 in IPCC-AR6-WGI shows values for SARF, the necessary adjustments, and the ERF for a doubling of CO\(_2\) from 278ppm. The SARF is estimated at 3.75 W/m\(^2\) and the ERF at 3.93 W/m\(^2\), so they differ by about 5% from each other. The difference results from the different adjustments:
\[\begin{align} & 3.75 & \text{SARF} \\ - & 0.6 & \text{troposphere temperature adjustment} \\ + & 0.22 & \text{water vapor adjustment} \\ + & 0.45 & \text{cloud adjustment} \\ + & 0.11 & \text{albedo/land cover adjustment} \\ \hline & 3.93 & \text{ERF} \\ \end{align}\]The small land cover / albedo adjustment could stem from the fact that increases in CO\(_2\) have quite quick responses in vegetation, for instance that there is less evaporation since plants have more CO\(_2\) available and then need to open their stomata less to get the CO\(_2\) they need. This leads to changes in soil moisture and albedo. Plants also potentially grow better under higher CO\(_2\) (all other factors being equal), so another effect could be more greening, which also affects albedo.
And why is the troposphere temperature adjustment negative? Well, unlike the stratosphere, which cools with increasing levels of CO\(_2\), the troposphere warms. So then, there will be increased emissions of longwave radiation, thereby increasing longwave radiation going out to space, thus decreasing the energy imbalance. Note that this is an extreme simplification of things :).
How is radiative forcing related to the energy balance of the Earth?
This is where it often gets tricky for people, and the relation between RF and the energy balance is a common point of misconception. Because they are not the same thing!
So, what happens to a radiative forcing over time? With time, Earth will warm up, thereby increasing the outgoing longwave energy, and thus decreasing again the energy imbalance at TOA that was initially created from the radiative forcing. So does radiative forcing go down? No! Here’s why: Let’s say we are on Earth in pre-industrial times, with a balanced energy budget, so the same amount of solar energy is coming in as the longwave radiation going out. We have 278 ppm CO\(_2\) in the air. One day, we burn so much coal, oil, and gas, that we double the concentrations in the air to 576 ppm (note: we are currently at ~425 ppm in January 2025, https://gml.noaa.gov/ccgg/trends/).
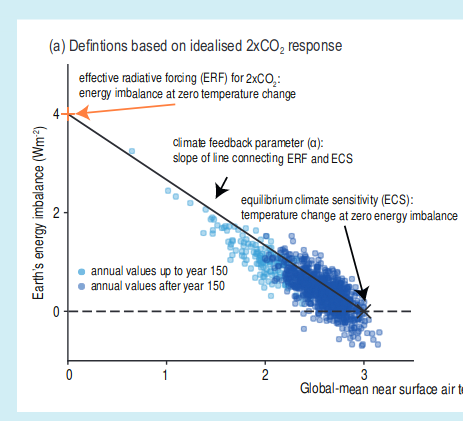
This doubling of CO\(_2\), as we have now learned, leads to a positive radiative forcing - it changes the net balance between incoming and outgoing radiation, leading to an imbalance, with more energy coming in than going out. Let’s say this change is 4 W/m\(^2\). What happens now? Well, the planet warms! With this warming, the outgoing longwave radiation increases, so the imbalance slowly goes down while the planet warms, until a balance is reached again. So, the radiative forcing becomes zero, right? No! The radiative forcing still only refers the initial change in the system. If the CO\(_2\) concentrations remain at 576 ppm, the radiative forcing will still be those initial 4 W/m\(^2\) because it refers to the external change that was applied to the system! But, of course, the energy imbalance has gone down. That’s why I say it’s a matter of vocabulary: The imbalance at the top of the atmosphere, which was initially also 4W/m\(^2\) due to the radiative forcing, will eventually go down to zero again, when the planet has warmed sufficiently. How much warming that is, is in this case called the Equilibrium Climate Sensitivity (ECS). I say “in this case” because ECS specifically refers to the experiment of doubling CO\(_2\), nothing else. If we don’t double the CO\(_2\) concentrations, the effect is similar, but the temperature that is reached will not be called ECS. Fig 1 from the IPCC report illustrates this example: The energy imbalance starts off at the same value as the radiative forcing (4 W/m\(^2\)), and goes down to zero as the surface temperature increases.

A note on doubling CO\(_2\) concentrations
Now you might say, “Wait a minute! Ok, it makes sense that temperatures increase until the energy balance is eventually 0 W/m\(^2\) again after we blew all that carbon into the air. But, I’ve read the Global Carbon Budget, and that stuff doesn’t stay up there! Vegetation and ocean will take up roughly half of this again!” (Friedlingstein et al, 2023). Yes, that is a very important point! This doubling of CO\(_2\) is quite an idealized scenario. It is very helpful to understand and quantify mechanisms, but it ignores a bunch of things! It assumes, that the concentrations remain doubled in the atmosphere forever (well, or until the time that the energy balance is zero again, because then the experiment is over). But, yeah, having stable concentrations would actually require us to blow some more carbon into the air, to maintain the levels. If we didn’t do that, concentrations would go down, because plants and oceans will take up some of that additional carbon from the atmosphere. To assess what would really happen if we blew all that CO\(_2\) in the air, we need to talk about TCRE - the transient climate response to cumulative emissions of CO\(_2\). This really refers to blowing carbon in the air to a certain extent, and then see what happens while also accounting for the carbon cycle, i.e., carbon uptake by plants and ocean. I don’t want to go into more detail here, but I found it important to mention this aspect for clarity.
Enough of the theories, what are the numbers?
How much is the current radiative forcing?
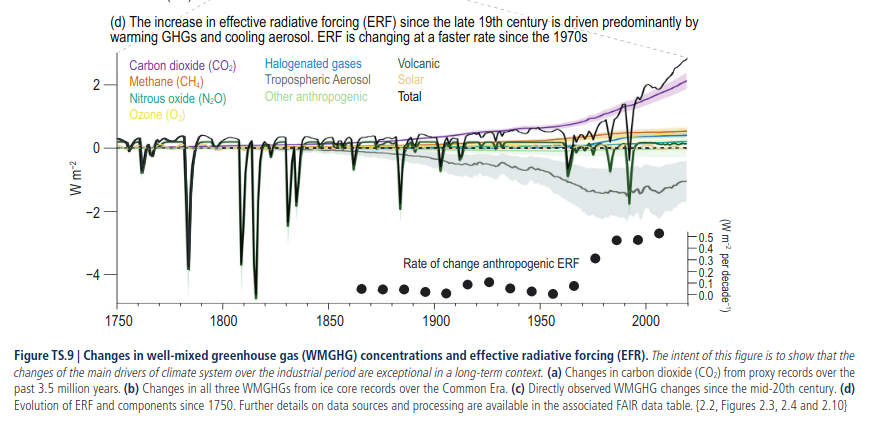
The total anthropogenic ERF in 2019, relative to 1750, was estimated at 2.72 [1.96 to 3.48] W/m\(^2\) compared to 2019 according to the IPCC, with increasing growing rates (IPCC-AR6-WGI-TS, p 67).
This figure shows the estimated radiative forcing over time. In 1750, it was close to zero. Then we started blowing greenhouse gases into the air. Not much changed for a while, probably because land and ocean took up most of this excess CO\(_2\), so no big deal. But with time, the emissions became larger and larger, and the radiative forcing went up. Note also the negative radiative forcing from tropospheric aerosols! This is basically pollution, which blocks sunlight and thereby decreases the total radiative forcing. You can also see that the pollution is going down since around 2000 (its RF is going up). This is good for human and animal health, but actually will increase global warming. Quite the conundrum. Note also the huge spikes from volcanoes but also how short they last. Solar influence is barely visible in the graph. It has a tiny impact.

How much is the current energy imbalance?
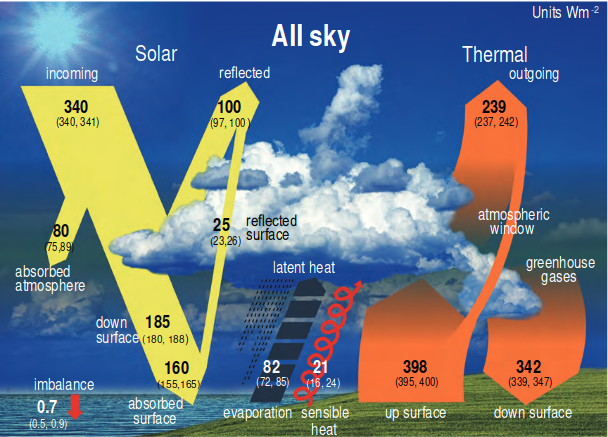
Ok, we now know by how much we changed the system. But what does this mean for the actual energy imbalance, since we learned that the two are not the same? Well, measuring the energy imbalance is really hard, for instance because it is completely different in different regions. Think about a partially cloudy day. At one location it is sunny, and a lot of solar radiation is coming in, but a few meters away, a cloud will be between the sun and the surface, so the radiative balance is completely different there. But new satellite programs now shed more light onto this question, and current estimates are around 0.7 W/m\(^2\) (IPCC-AR6-WGI) and 0.9 W/m\(^2\) (Trenberth and Cheng, 2022). Fig 7.2 of IPCC-AR6-WGI show all major pathways of radiation on Earth, and indicate the imbalance of 0.7 W/m\(^2\).

Take a moment to note how little that actually is: not even 1 Watt! The lamp shining on my desk right now has 5 Watts! But remember, this is per m2, so we’re talking about A LOT of lamps. The total imbalance summed up over the Earth’s surface is roughly 460 TW, which is about 80 times the total electricity generation on Earth, so yeah, that stuff matters a lot.
Radiative forcing in the future
So how will this look like in the future? The IPCC uses shared socio-economic pathways to estimate human behavior in the future and thereby estimate our impact on the climate. These contain assumptions about population growth, GDP, which result in certain emissions and land use patterns. Those scenarios are labeled SSPX-Y, e.g., SSP3-7.0. The number X here represents the socio-economic pathway and we will ignore that here. The number Y “refers to the approximate target level of radiative forcing (in W m–-2) resulting from the scenario in the year 2100.” (IPCC-AR6-WGI-TS, p. 54
So for instance, an SSPX-2.6 pathway is a pathway where radiative forcing peaks at approximately 3 W/m\(^2\) and then declines to be limited at 2.6 W/m\(^2\) in 2100 (IPCC-AR6-WGI-AnnexVII, glossary for RCP). Remember that we said above that the radiative forcing is not the same as the imbalance, and is just a measure of the perturbation to the system. But in this pathway, the radiative forcing goes down! So this means that the initial perturbation will be slightly counteracted, for instance by removing some carbon from the atmosphere again.
A short remark as to which type of RF is actually used in the SSP definitions. To be honest, I have gotten furious while writing this because I could not find ANY mention of which radiative forcing the SSP labels actually refer to. However, in the end I found the apparently single mention about this among all thousands of pages of IPCC documents. It is in the executive summary of the WGI report:
In the SSP labels, the first number refers to the assumed shared socio-economic pathway, and the second refers to the approximate global effective radiative forcing (ERF) in 2100.
Of course, the IPCC mentions in other places that ERF is the central definition. But it would have been nice to be more clear about this in the descriptions of the SSPs.
Will the SSP scenarios hit exactly the mark they should?
No. As stated in Meinshausen et al. (2020):
It should be noted that the radiative forcing labels, such as “2.6” in the SSP1-2.6 scenario, are indicative “nameplates” only, approximating total radiative forcing levels by the end of the 21st century. Those labels are merely indicative, given that actual radiative forcing uncertainties (and differences across ESMs that implement the same concentrations, aerosol abundances, ozone fields, and land use patterns) are substantial.
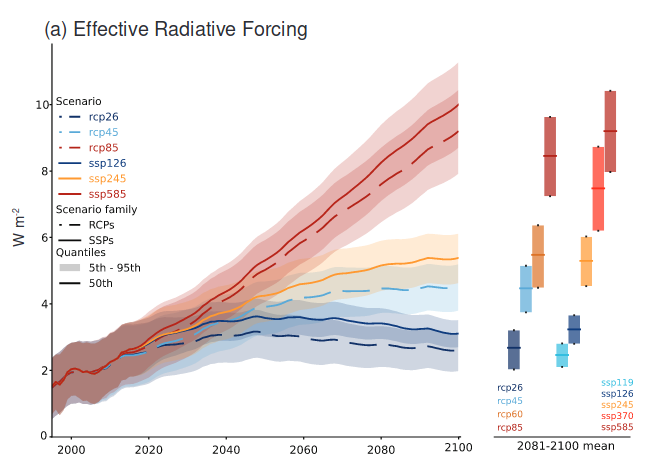
Interestingly, the labels are quite a bit off in some cases. See for example the following figure (IPCC-AR6-WGI, Fig 4.35) that shows a few SSPs. SSP5-8.5, for instance, reaches 10 W/m\(^2\) in 2100, not 8.5 W/m\(^2\).

Note that the lines are model medians (not means), the spread comes from different representation of processes by the models, leading to somewhat different radiative forcings. More values can be found in the Annex of that report (Tables AIII.4, IPCC-AR6-WGI-AnnexIII)
See also Smith et al., 2020 for more details on the different RFs computed by the models of CMIP6.
Are RCP8.5 and SSPX-8.5 the same?
Actually no, there is a difference because the way that RF was computed changed over time. While SSPX-Y refers to Y effective radiative forcing, RCPY refers to SARF while SSPX-Y refers to the effective radiative forcing. Notably, if you look at the figure above, where the ERF is computed for both SSPs and RCPs, they also do not align.
And the IPCC also states:
The SSP scenarios and previous RCP scenarios are not directly comparable. First, the gas-to-gas compositions differ; for example, the SSP5-8.5 scenario has higher CO\(_2\) concentrations but lower CH4 concentrations compared to RCP8.5 (IPCC-AR6-WGI p. 231)
Conclusion
If you read till here, congratulations! This really was quite complex. It took me a full week of reading to finally get it and hopefully my summary was helpful to you. Here are the main points:
- RF is a complicated topic
- There are three types of RF, ERF is the most important one, accounting for those processes happening after the forcing that are not related to surface temperature change (e.g., changes in stratospheric temperature)
- RF is not the energy imbalance, only the forcing. While the energy imbalance will go down with warming, the forcing will remain constant (referring to the perturbation to initial conditions)
- The RF can be reduced by countermeasures to the original perturbation, e.g., removal of CO\(_2\) from the atmosphere
- Current radiative forcing is around 2.7 W/m\(^2\), Current energy imbalance is around 0.7-0.9 W/m\(^2\)
- Projections of SSPs refer to the ERF and only roughly reach the prescribed RF values in 2100
References (IPCC Reports)
- IPCC-AR6-WGI: https://www.ipcc.ch/report/ar6/wg1/downloads/report/IPCC_AR6_WGI_FullReport.pdf
- IPCC-AR6-WGI-Annex-III: https://www.ipcc.ch/report/ar6/wg1/downloads/report/IPCC_AR6_WGI_AnnexIII.pdf
- IPCC-AR6-WGI-Annex-VII: https://www.ipcc.ch/report/ar6/wg1/downloads/report/IPCC_AR6_WGI_AnnexVII.pdf
- IPCC-AR6-WGI-TS: https://www.ipcc.ch/report/ar6/wg1/downloads/report/IPCC_AR6_WGI_TS.pdf
Enjoy Reading This Article?
Here are some more articles you might like to read next: